Photo by Carl Heyerdahl on Unsplash
Programs Used:
Python, Tableau Public
Other Programs not featured in this project:
MySQL Workbench
Steps:
1. The Business Problem
2. The Data Set: Preprocessing
3. Analyze Data Using Python
4. Visualize Data in Tableau
5. Summary of Analysis
The Business Problem:
There are numerous internal and external factors that can influence absenteeism at work. In recent years the workforce has seen pandemics, exponential inflation, mass layoffs, and a complete redesign of how we show up to work. When we add these constantly evolving forces to the personal battles such as mental health, family dynamics, and physical well-being of the individual it can seem like there may be more reasons to be absent than to be present in the workforce.
Unfortunately, although a more in-depth look at how these modern issues have impacted absenteeism in the workplace is of interest to the business community as a whole, the data used in this project was gathered in a pre-pandemic era. Therefore, the reasons for absenteeism used in the predictive modeling focused on more traditional causes for absences, in an effort to identify gaps in the productivity of the workforce. In particular, if an employee can be expected to be absent for more than 3 hours within a single day in a given month, requiring a reorganization of the workforce. With that let’s jump into the data.
The Data Set
* Disclaimer: As programming is not a native language to me, I plan on using open-source code and prepackaged analysis products in future projects. However, since this article is a demonstration of the topics covered within The Business Intelligence Analyst Course, and a demonstration of my learning, I have opted to leave a bit more detail in this section than I would have otherwise. Please feel free to skip to the next section if you choose.
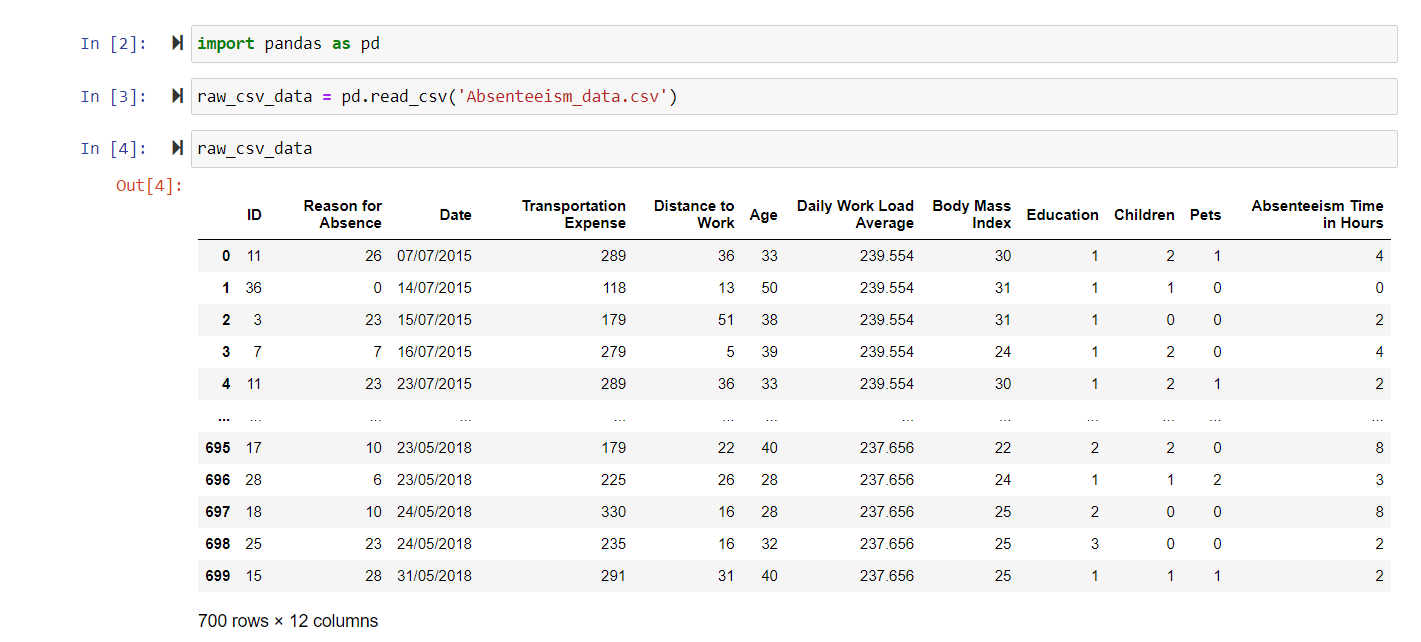
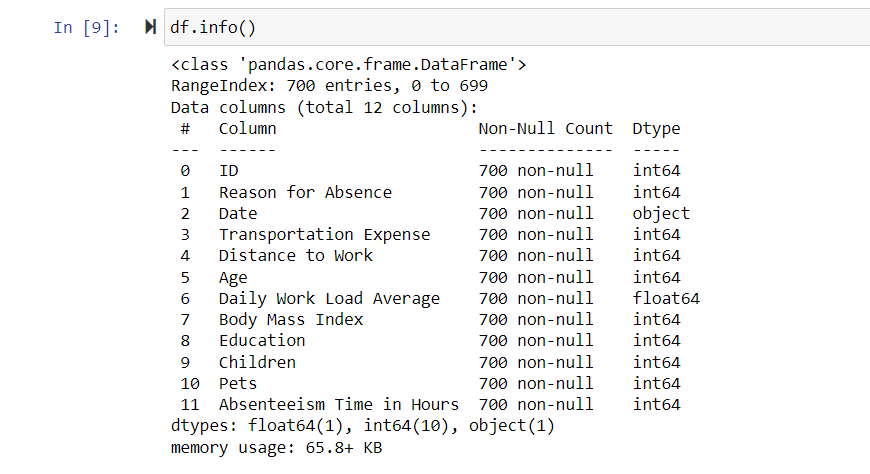
The data set used in this project was secondary data pulled from a pre-pandemic study on absenteeism in the workplace. The population of 700 employees, contained both basic demographics such as education and the number of children, as well as quantified causes for absenteeism such as illness and pregnancy. Each entry was unique and there were no duplicates or null values contained in the file.
Data Preprocessing
The first step of preprocessing was to upload the .csv file to python for processing using pandas. Absenteeism time in hours was the dependent variable being examined. The data was then double-checked to ensure it did not contain any Null values.
The data contained a total of 28 reasons for Absence. These were further broken into four main categories: Chronic Disease, Pregnancy, Emergencies, and Routine Illness and Appointments.
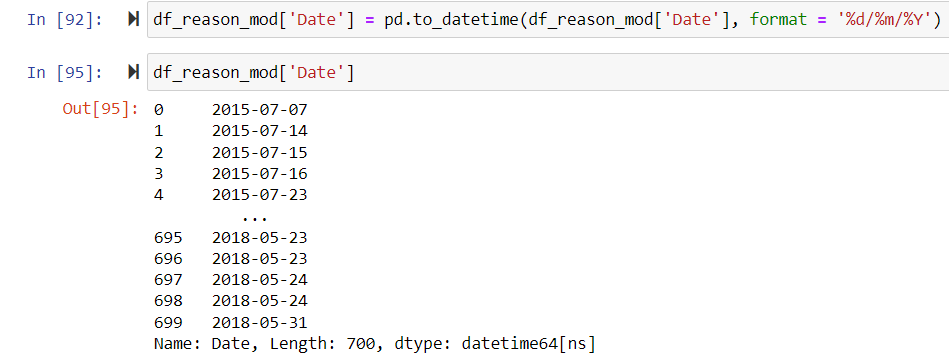
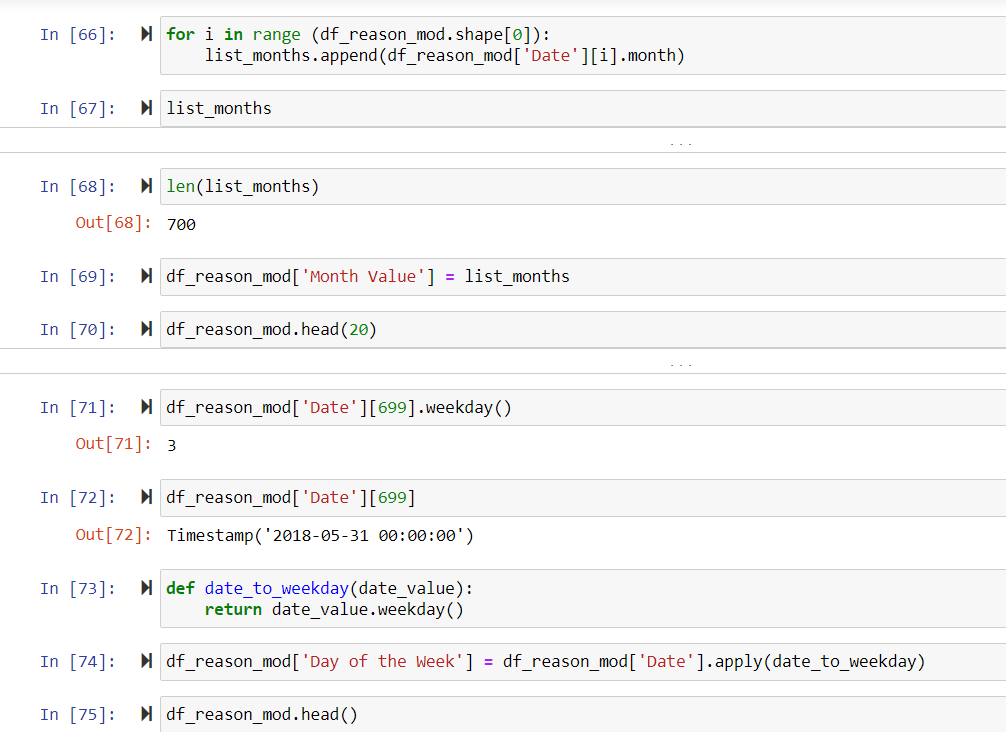
For the purpose of analysis, the dates were converted to timestamps and further broken into month and day-of-the-week values.
Lastly, Education was summarized into 2 main categories; High School and Advanced Education, since there was not enough data to infer any significance among Absenteeism from those with post-Graduate education vs Ph.D.
Analyze Data Using Python
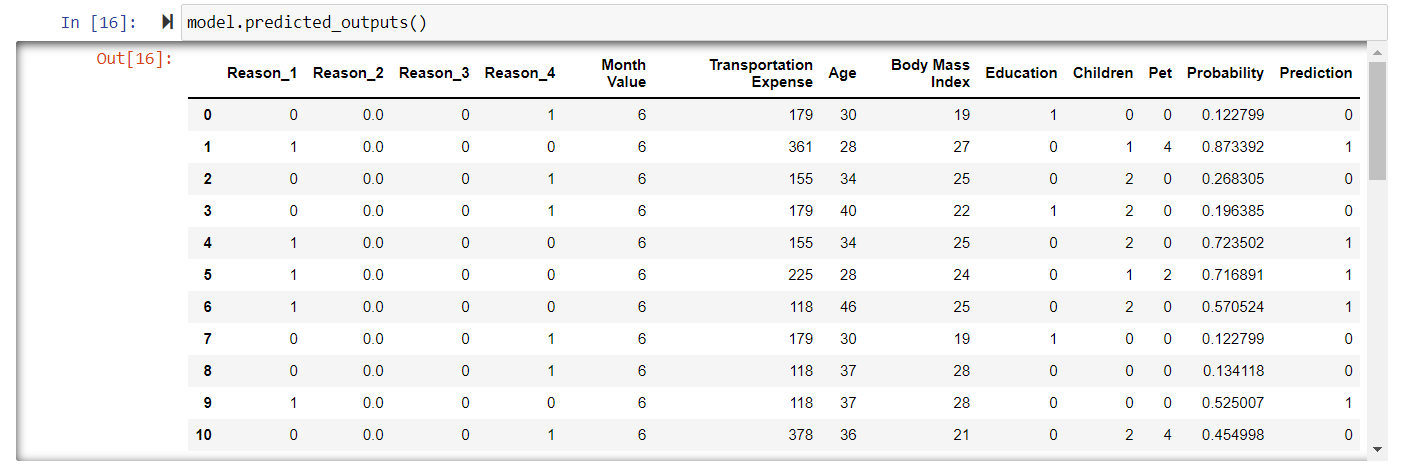
The module used was written by the course instructor, and it is ‘assumed’ for the purpose of this course that it was designed by a data science team that developed a model for logistical regression to predict absenteeism. Since I am still a novice coder, and I did not have access to the primary data for deeper examination, I did not attempt to alter the model from what was provided by the instructor. Therefore, the following is a glimpse into the variables that were removed from the data set by the module, as well as the resulting probability data of the regression model.


Visualize Data in Tableau
Once the data was analyzed in python, the resulting CSV file was uploaded to Tableau Public for further analysis and visualization. It is important to note at this point that in addition to several potentially significant variables such as distance traveled, and workload, the data was reduced to a population of 40. This is presumable to make it simpler for students to visualize in the Tableau program. Unfortunately, it also prohibited me from adding back in any variables I may have wanted to examine further without knowing exactly where or why the module removed inputs
Summary of Analysis
After reviewing the limited data available for this project, there were a few obvious factors that contributed to the Absenteeism of an individual from work such as Major Diseases, as demonstrated in the plot where 0 is a negative correlation and 1 is a positive correlation.
There were also some interesting intersections when looking at the Transportation Expenses and Children as they correlated with Absenteeism. The graph below shows the increased probability of Absenteeism for those with one or more children who have higher transportation costs. Given that further analysis is not possible without the original data set, we will assume for the purpose of this analysis that those with higher transportation costs live further from the workplace and that those with children are more likely to live in suburban areas further away from the workplace.
Holding for those variables, we can conclude that those employees with children have a higher associated cost in both money and time in regard to commuting to and from work. This increased cost analysis significantly influences the employee's decision to be absent from work for a significant period of time. Therefore, as a hiring manager for a business, we would have to ensure to hire enough part-time employees to account for the lost time of not only those with chronic illness but also those with larger families in order to maintain workplace productivity.
Why part-time and not full-time employees? Well, that goes into another cost-benefit analysis of any business. We have a set number of skilled full-time employees to account for 80% of the productivity, then we supplement with lower-cost part-time employees to make up the other 20% of productivity lost with factors such as Absenteeism, Socializing, etc. Each business has to decide for itself its magic ratio, but as inflation and employment cost continue to increase, I predict that underemployment may become a bigger issue in the days to come.
In summary, there are many insights one could have pulled from the data, but I doubt any model could accurately predict absenteeism post-pandemic. It would imply that the workforce and environment were stagnant and predictable. If we have learned anything these past few years is that you cannot predict the future. As workplaces are dispersed and workdays become flexible the definition of productivity is evolving, and issues such as chronic illness and childcare are less significant factors to a remote workforce. That said, I feel this was still a valuable exercise that served to strengthen my knowledge and understanding and prepare me for work in the field of Business Analysis.

